EventTracker: Event Map
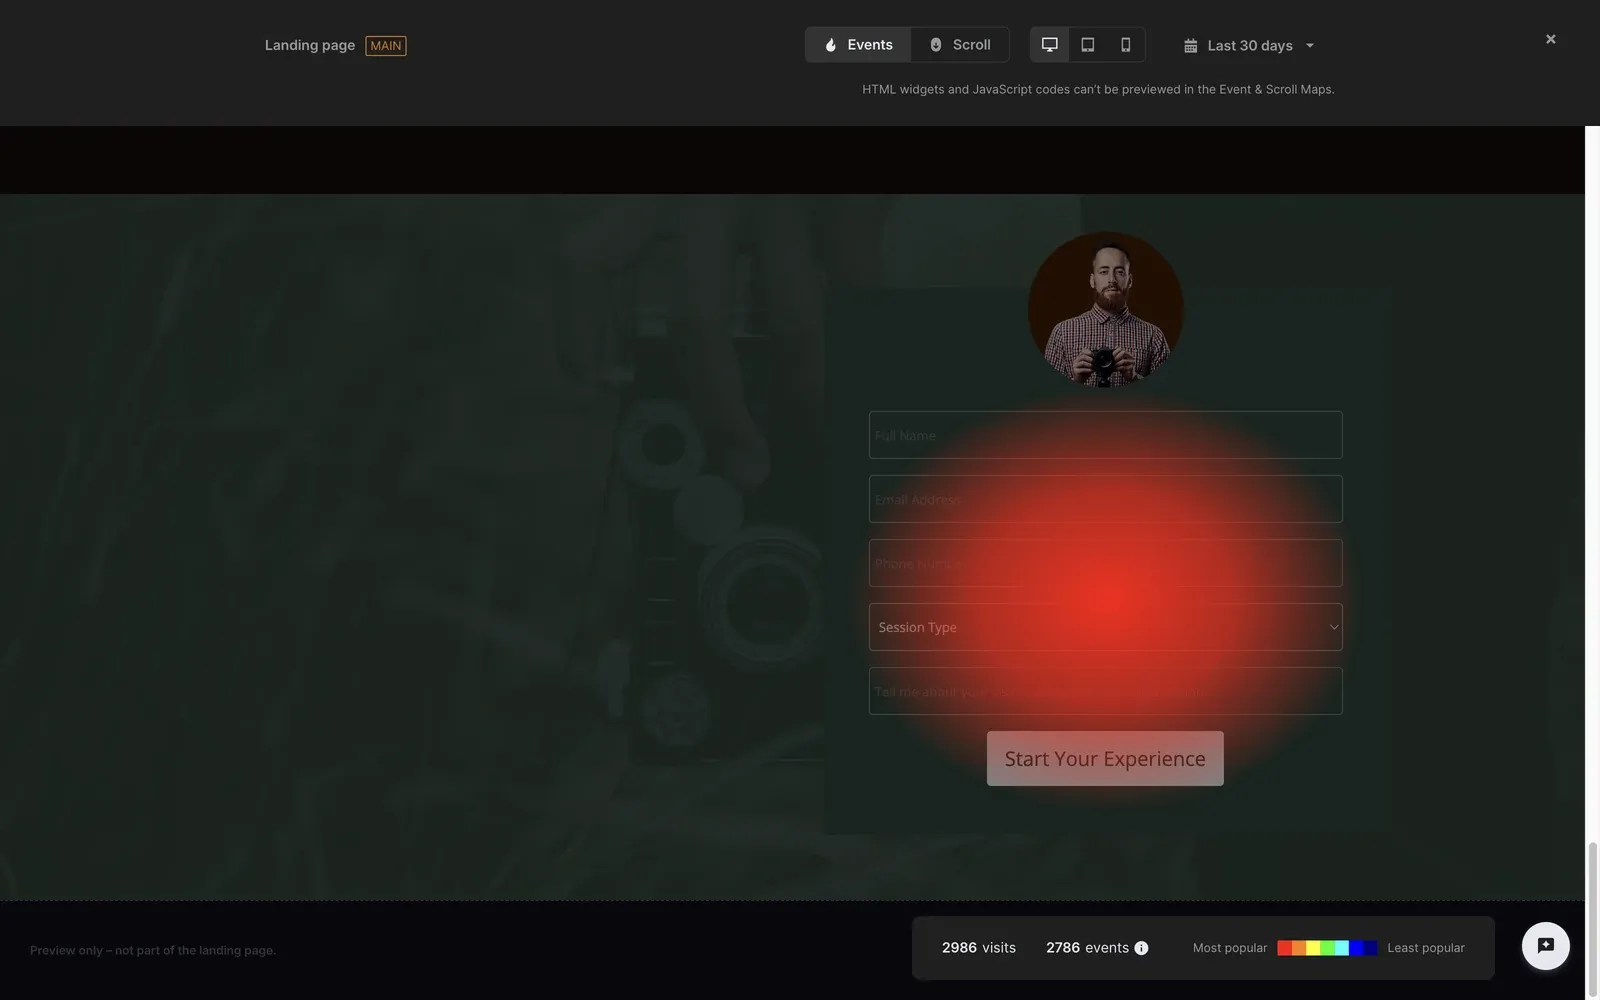
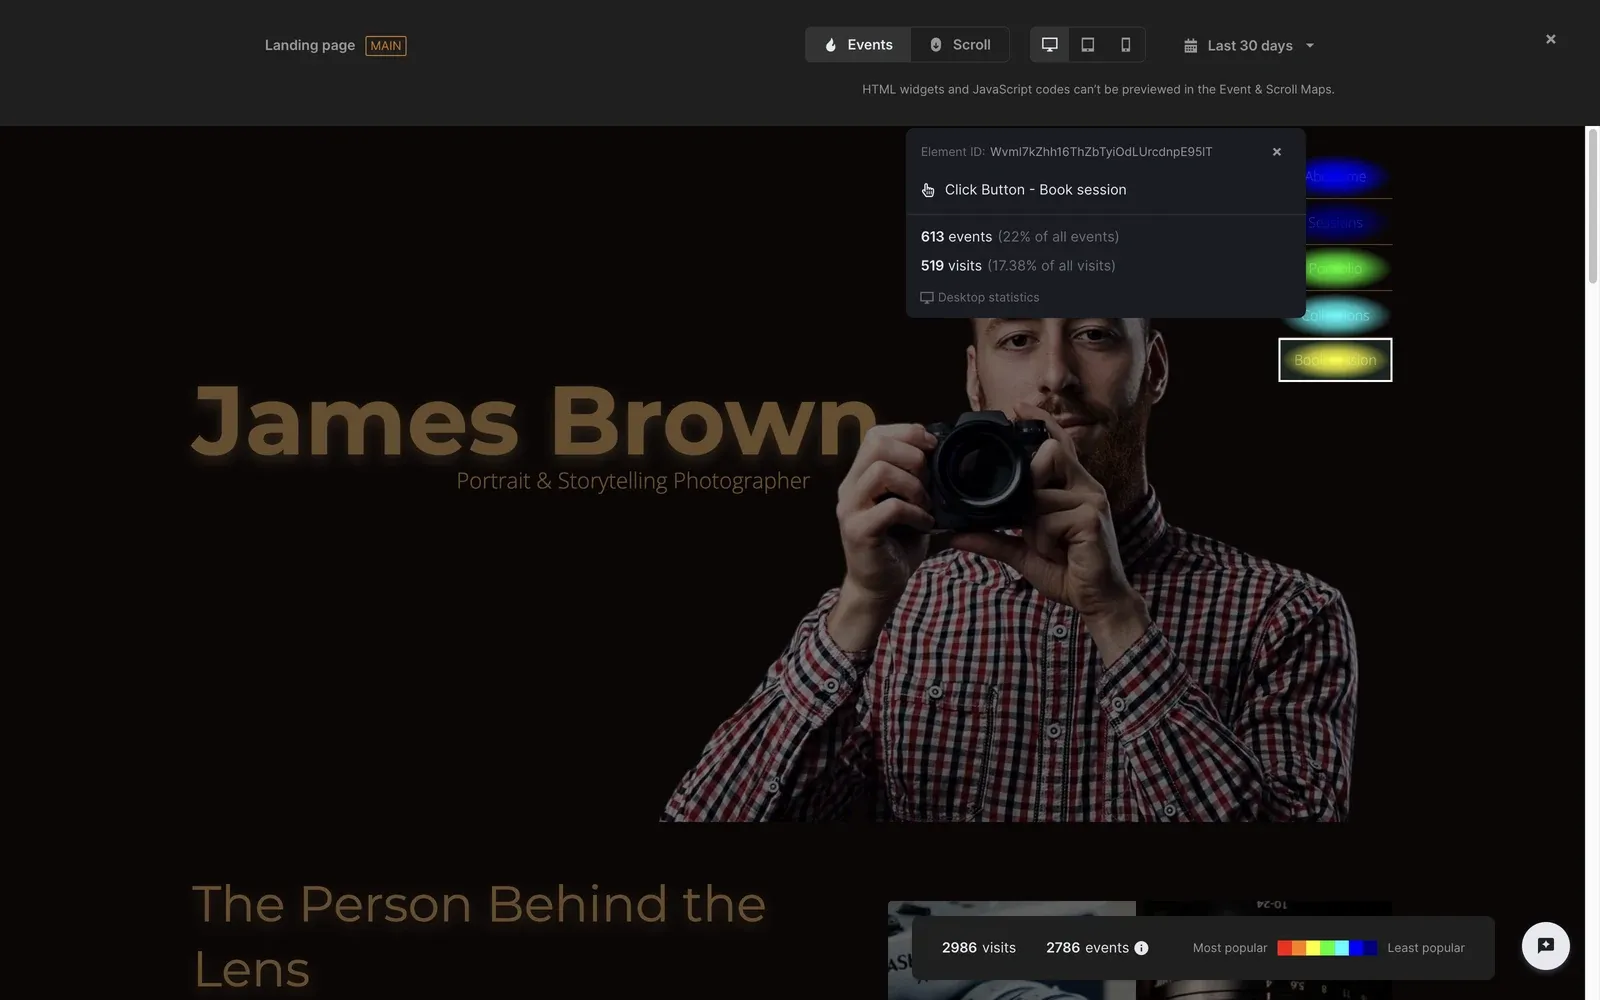
Development of the Event & Scroll Map module in EventTracker, enabling visual analysis of user behaviour on landing pages. The project involved building an interactive page preview with overlaid events and a scroll depth map.
 – enlarge
Where it started
EventTracker provided user behaviour data as event lists and statistics, but there was no way to visualise that data directly on the landing page. Numbers alone did not show where clickable elements were located or how far visitors scrolled, which made the data harder to interpret.
The challenge
I was responsible for building the Event & Scroll Map module from scratch in the SPA, covering navigation, state management, the landing page preview and the scroll map. I developed the event map in collaboration with another frontend developer.
How I built it
I built an interactive landing page preview in an iframe using srcDoc, adjusting its width to match the selected device. I implemented a mechanism for transferring application styles into the iframe, covering CSS selector scoping, import handling and light/dark theme synchronisation via MutationObserver. Data overlays were rendered directly into the iframe document using createPortal.
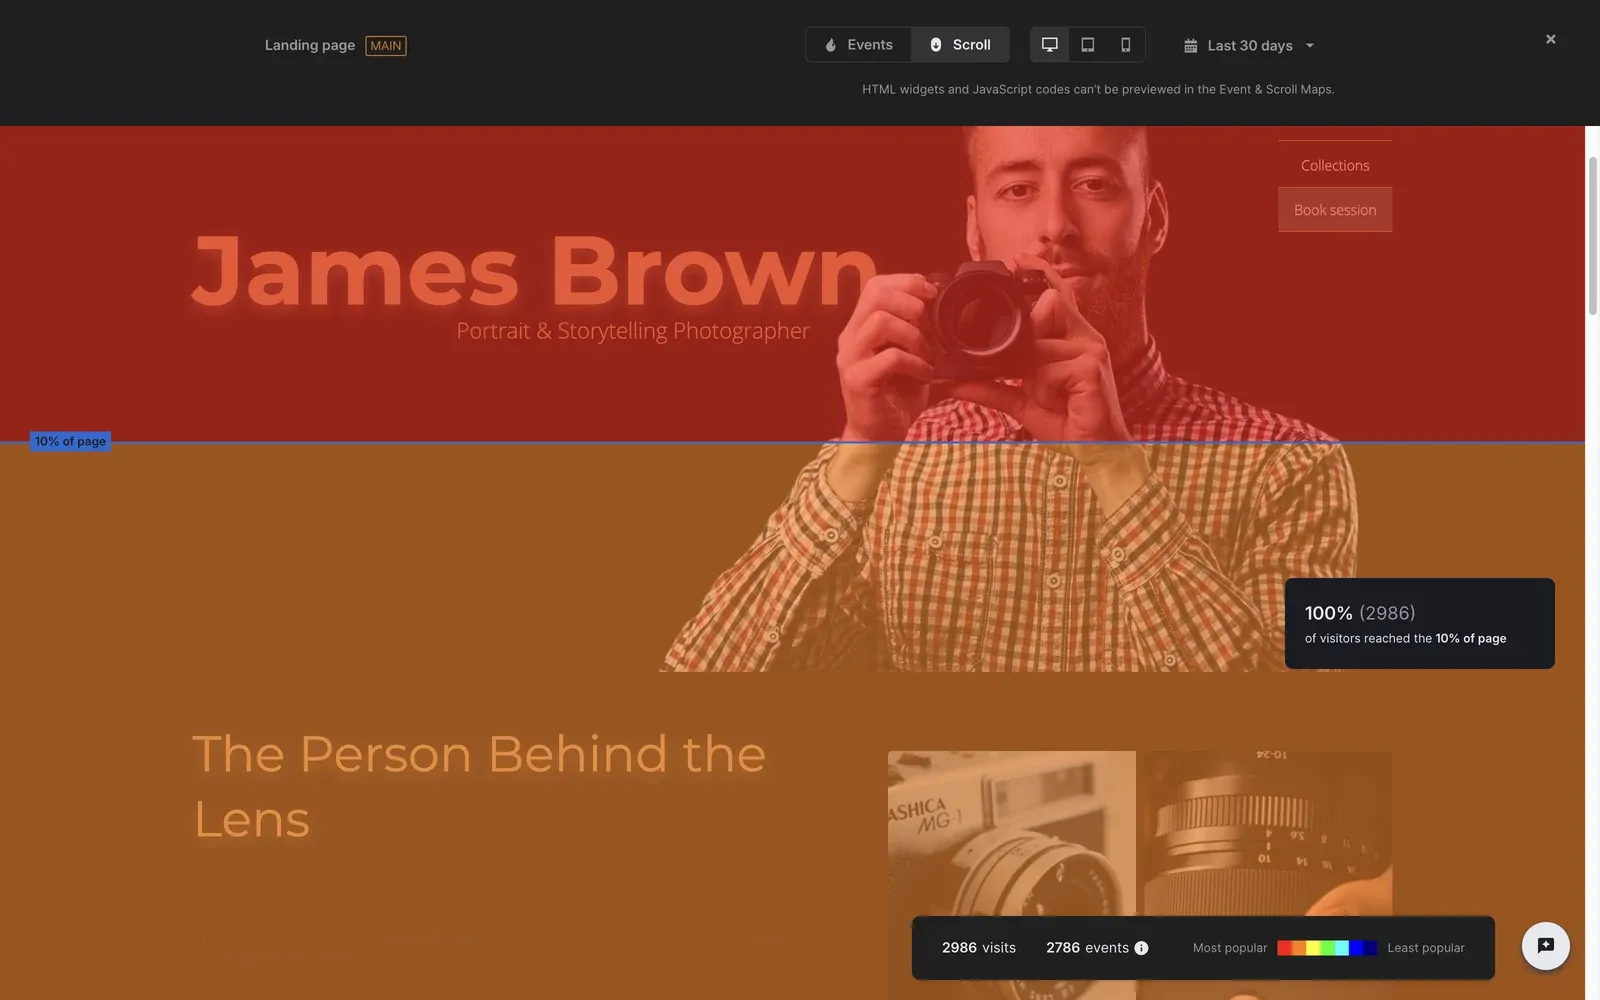
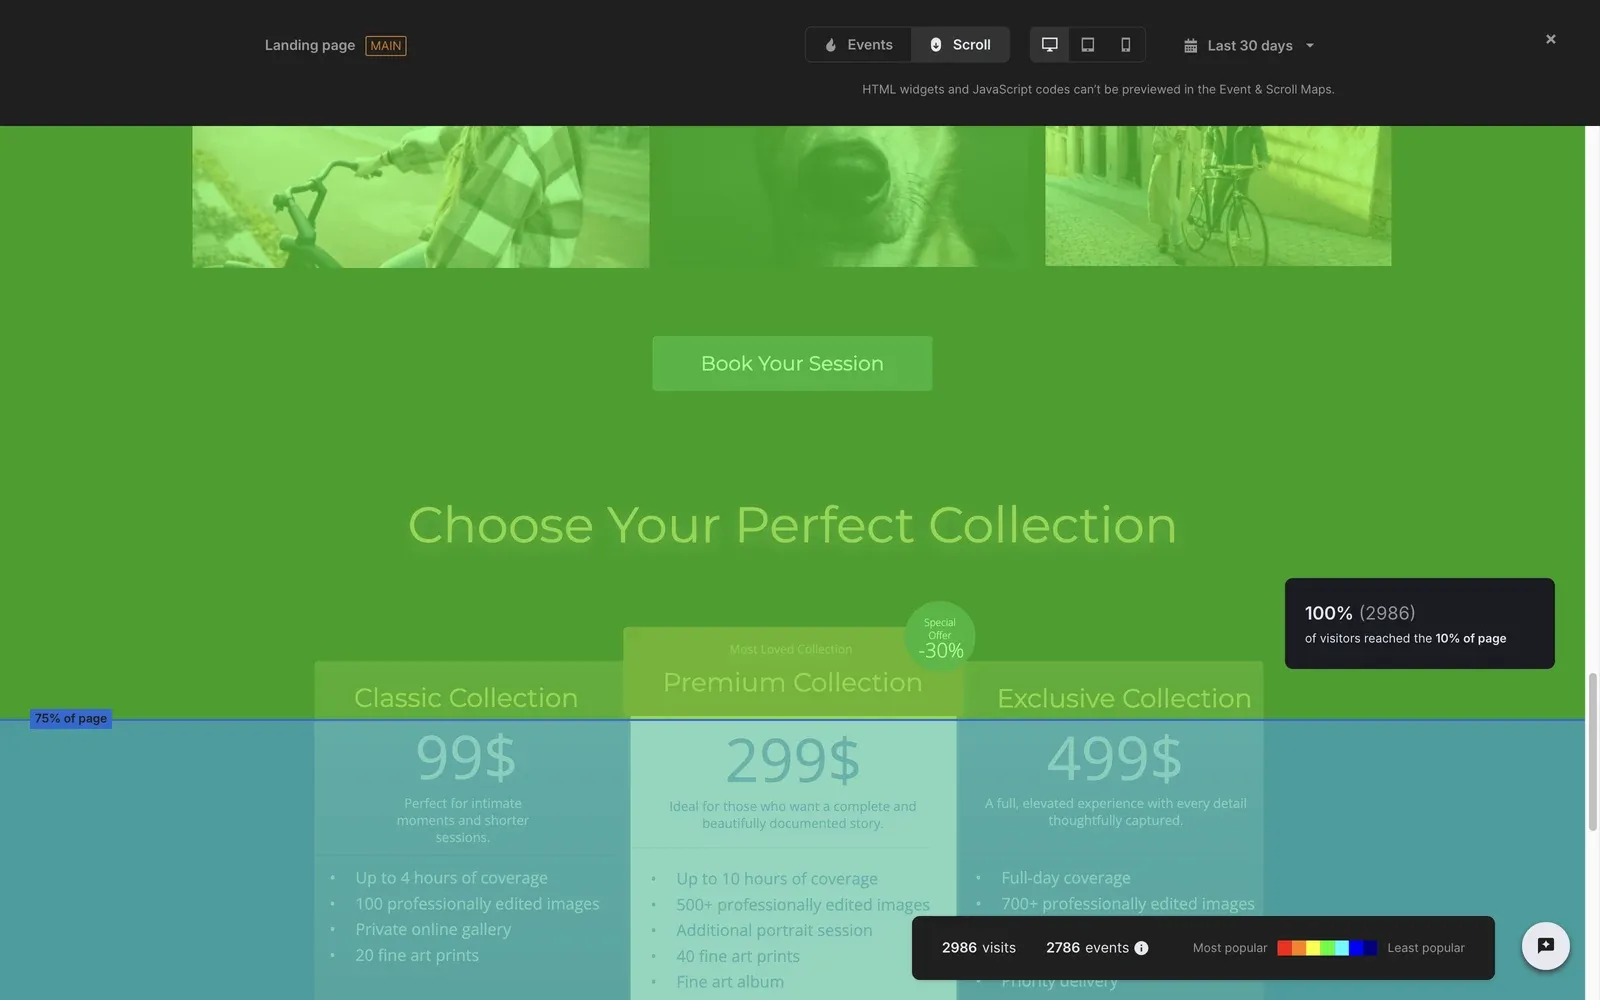
I built the scroll map from scratch, dividing the page into depth bands from 10% to 100% and colouring each area based on the percentage of users who reached it.
Within the event map I implemented the ability to jump from the event list directly to the corresponding location on the page preview. I also added a details panel positioned with Floating UI and support for combined events.
I integrated the module with the API using SWR and implemented filter state management in URL parameters, covering device, page type, variant, date range and selected view. I also added interactive tours with react-joyride, dark theme support and automated tests in Vitest and Testing Library.
The outcome
The result is a module for visually analysing clicks, events and scroll depth directly on the landing page preview. Users can see which page elements generate interactions and how far visitors get, filtered by device, variant and date range.
The integration with the event list makes it quick to go from a statistic to the exact spot on the page, helping users analyse behaviour and identify areas that need optimisation.